
The setting
It has been about a month since we have really started to feel the impact of Covid-19 in Canada. Outside of the virus itself, the preventive measures (social distancing, closures of schools, etc.), while necessary, have also impacted our daily routines and habits. Google search trends can help provide some insight into how our behaviours are changing, as a google search is often the first step one takes when wanting to purchase an item, learn how to do something, etc.
Importing the data
I will use the R package gtrendsR in order to obtain google search trend data directly from R. First I install the relevant packages:
library("gtrendsR") #tool to access google search trend data
library("dplyr") # for dataset manipulation
library("ggplot2") # for plotting
library("patchwork") #for arranging multiple related plots
I write a function that takes as input keyword_string which is a single or multiple keywords that I want to view the search trends for. I set the date from January 1st 2020 to April 5th 2020. I also limit the geographic region to Canada. I plot a vertical line on March 17th, which is the date many provinces declared a state of emergency, and thus may represent the date where social distancing became a reality for many Canadians.
plot_trend<-function(keyword_string){
data<-gtrends(c(keyword_string), time= "2020-01-01 2020-04-05", geo = "CA")
time_trend<-data$interest_over_time %>%
  mutate(hits=ifelse(hits=="<1",0.5,hits),
         date=as.Date(date),
         keyword=factor(keyword, levels = keyword_string))
plot<-ggplot(data=time_trend, aes(x=date, y=as.numeric(hits), colour=keyword)) +
  geom_smooth(method="loess",span=0.4, se=FALSE) +
  geom_vline(xintercept = as.numeric(as.Date("2020-03-17"))) +
  theme_bw() +
  scale_y_continuous(breaks = NULL) +
  theme(legend.position = "bottom",
        legend.title = element_blank(),
        legend.text=element_text(size=10),
        axis.title.x=element_blank(),
        axis.title.y=element_blank())
return(plot)
}
Closure of non-essential services
The first thing I want to look at was how the closure of non-essential services may have caused people to do things that they wouldn’t otherwise do. Getting a haircut, going to the gym, ordering a pizza, buying a coffee. These are all things that perhaps we have taken for granted in the pre-Covid-19 era.
hair_plot<-plot_trend(keyword_string = c( "barber","how to cut hair"))
food_plot<-plot_trend(keyword_string = c("italian restaurant","how to make pizza"))
fitness_plot<-plot_trend(keyword_string = c("goodlife fitness", "home workout"))
coffee_plot<-plot_trend(keyword_string = c("Tim Hortons coffee","how to make coffee"))

(hair_plot + food_plot) / (fitness_plot + coffee_plot)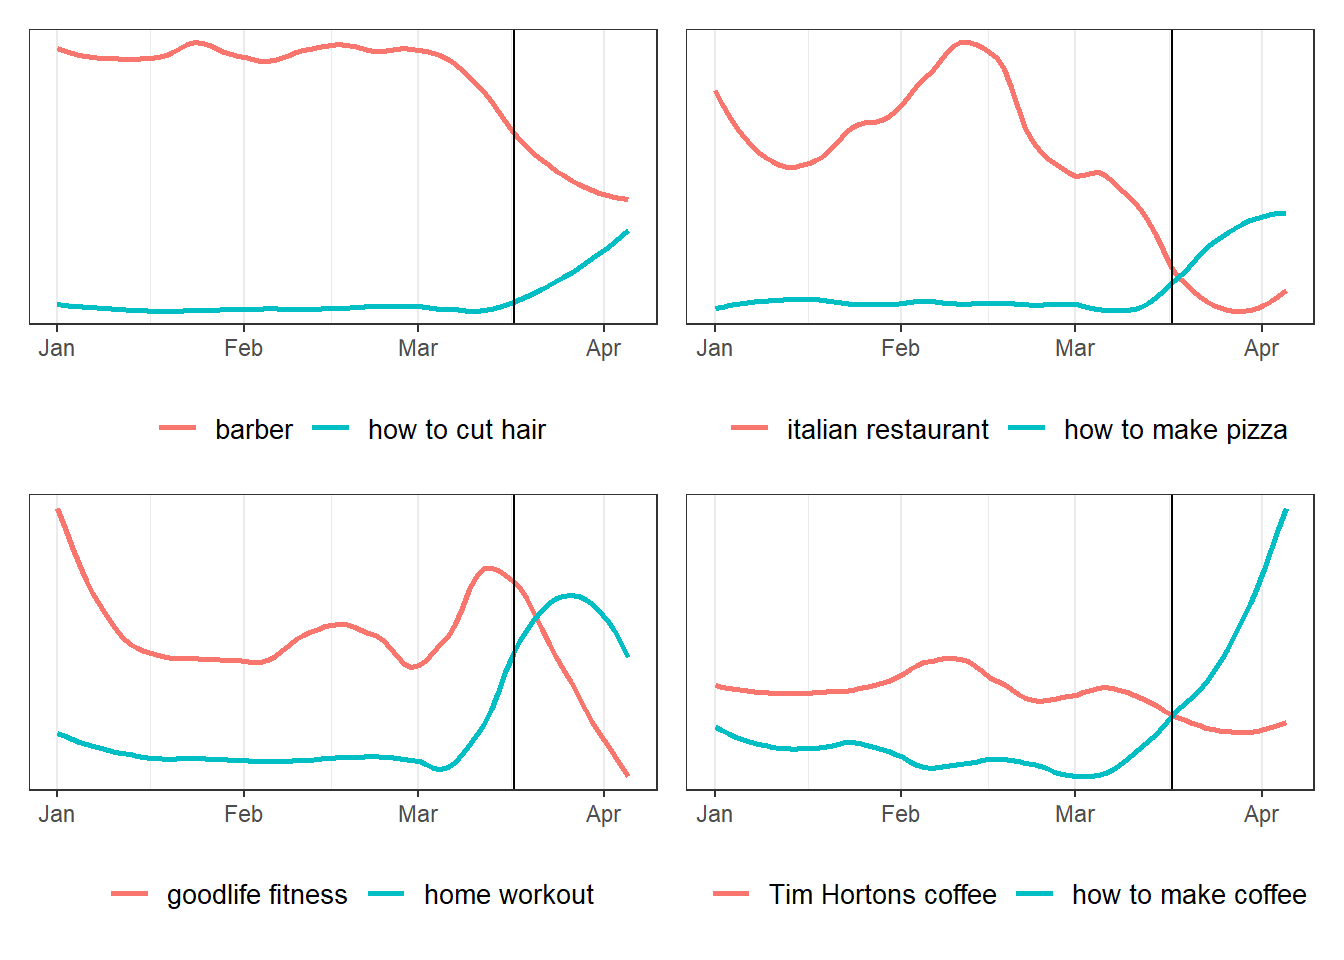
Desperate times call for desperate measures. Many are turning to Google to teach them how to cut their hair (a trend that will no doubt grow). On the bright side, people are learning essential skills like how to stay fit at home and how to cook pizza, two opposing but powerful skills to master (though it appears that the motivation for pizza is increasing while the interest in home workouts is waning).
Entertainment
With more people staying home, did more people look into streaming content at home? How about the major sports leagues, whose seasons were all put on pause.
streaming_plot<-plot_trend(keyword_string = c("disney +","netflix","prime video"))
streaming_plot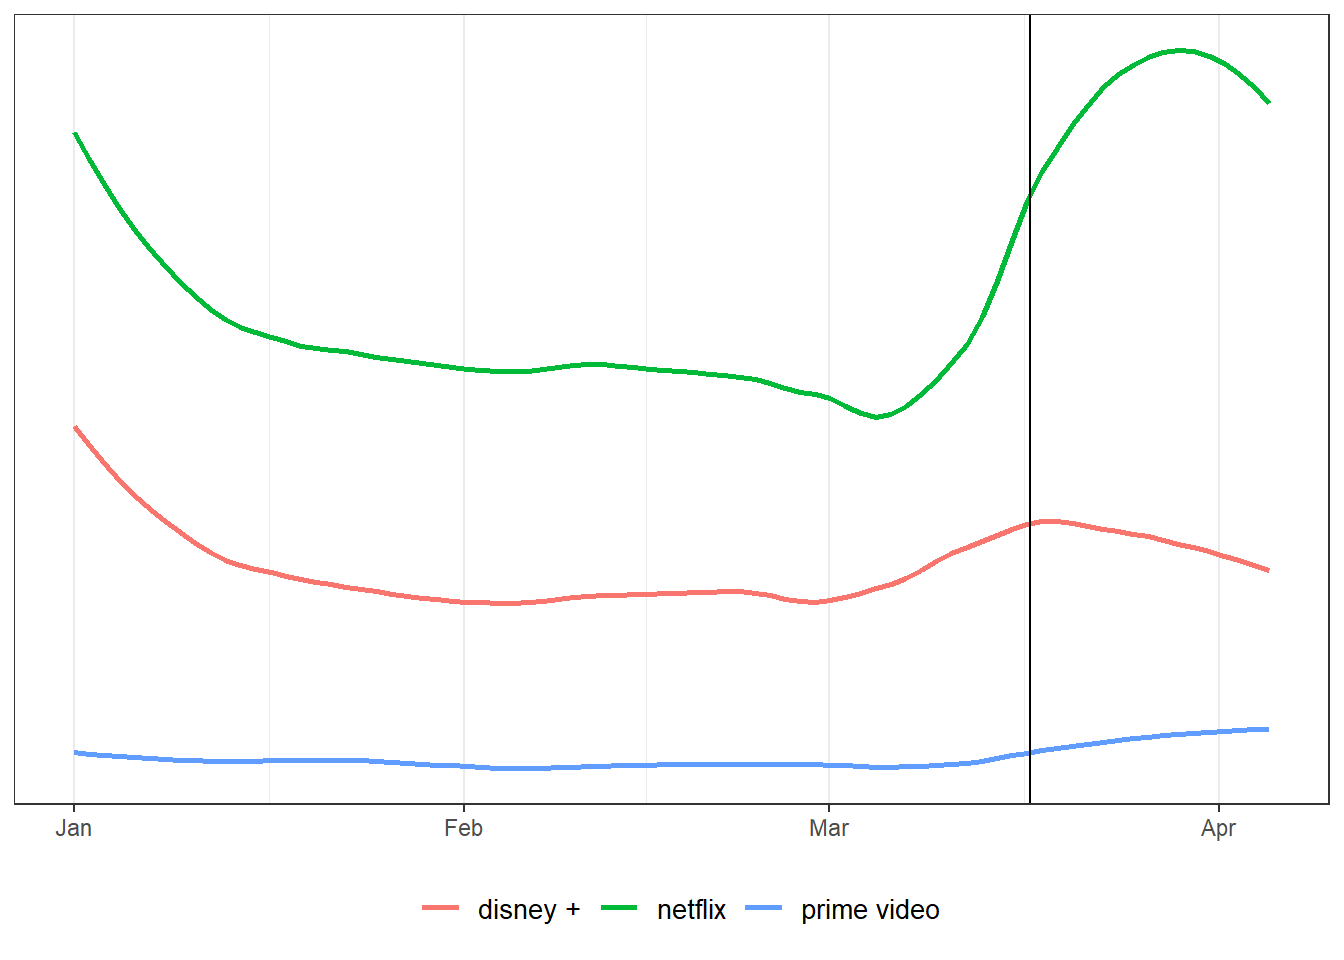
Looks like people defaulted to the most established streaming service, Netflix, while Disney + and Amazon’s prime video saw smaller boosts in search popularity.
sports_plot<-plot_trend(keyword_string = c("nba","mlb","mls","nhl"))
sports_plot + geom_vline(xintercept = as.numeric(as.Date("2020-03-12")), colour="darkblue")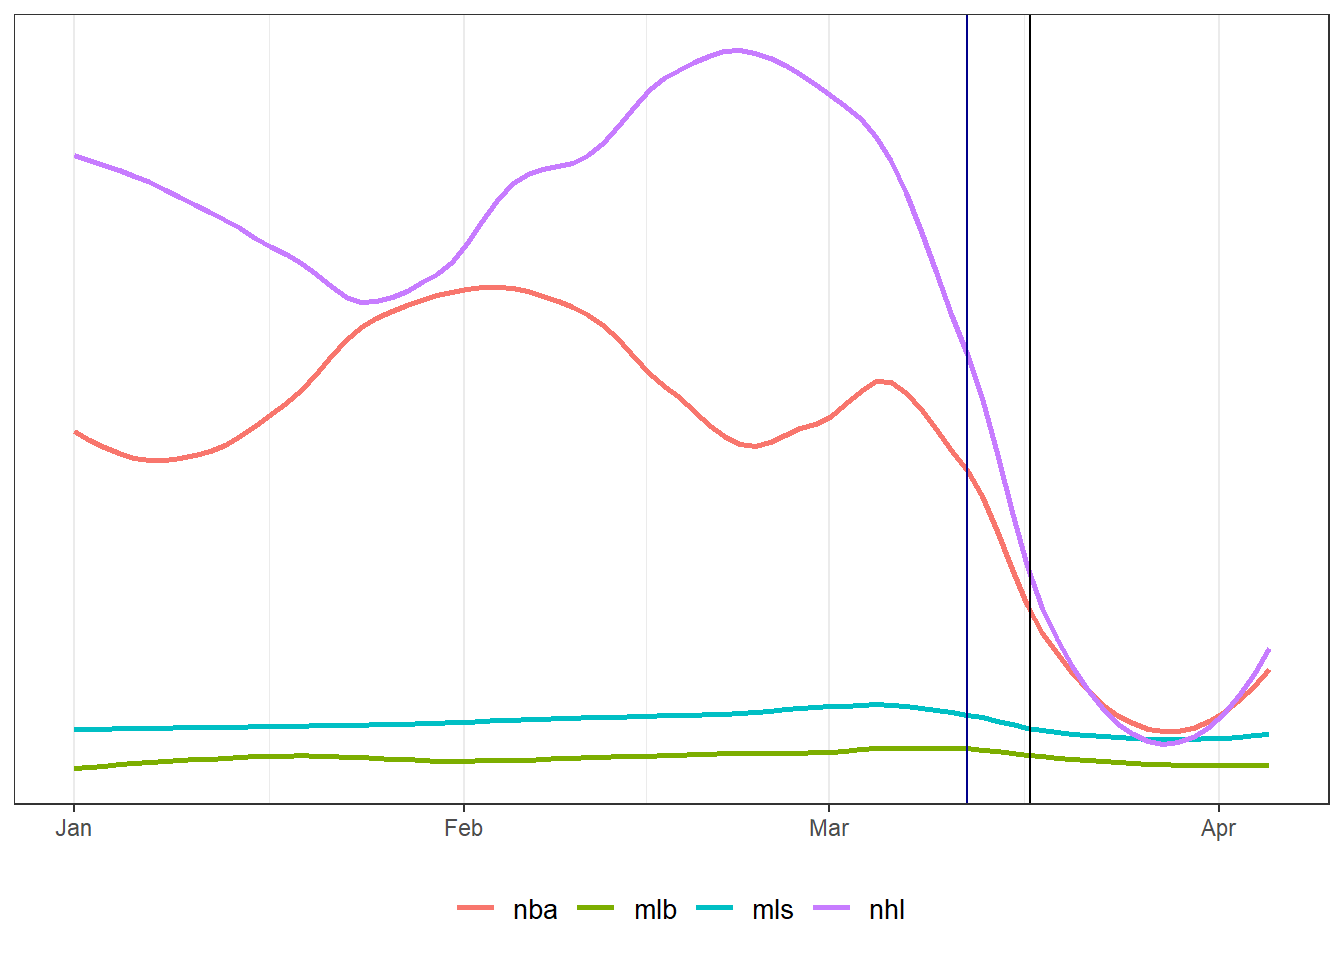
The NBA and NHL, both approaching the end of their regular seasons showed drastic drops in search interest as they were cancelled on March 12 (the first line highlighted in blue).
Working from home
With the large-scale transition to remote working, I wanted to explore how the interest in working from home tools - both technological and physical - would change. With many schools across Canada facing extended closues, I expected parents to supplement their knowledge with some internet searches as well.
teaching_plot<-plot_trend(keyword_string = c("how to teach math","how to teach english"))
homeoffice_plot<-plot_trend(keyword_string = c("office chair", "computer monitor","desk"))
video_plot<-plot_trend(keyword_string = c("zoom","skype","webex"))
communication_plot<-plot_trend(keyword_string = c("slack","discord","microsoft teams"))

(teaching_plot + homeoffice_plot) /  (video_plot + communication_plot)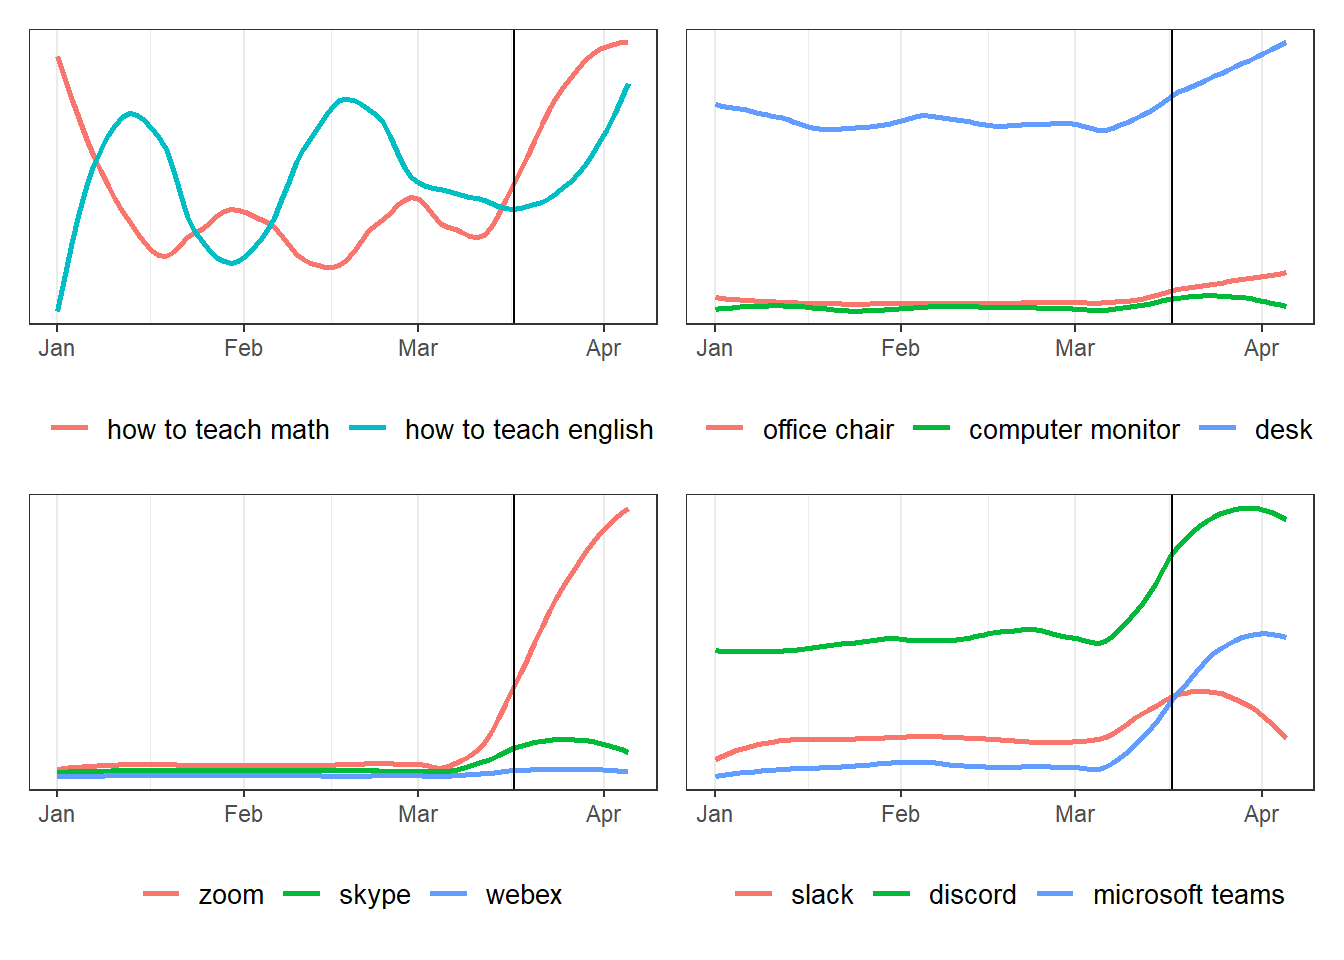
Looks like parents are needing refreshers on their math much more than their english. In terms of home office essentials, people seem to be most interested in getting a new desk as opposed to a new monitor or chair. Zoom seems to be the teleconferencing software of choice, perhaps due to it’s simplicity. Out of the text communication services, Microsoft Teams is seeing the quickest rise in interest.
Conclusion
The introduction of Covid-19 in Canada has introduced significant societal change, and Google searches present an interesting way to gauge the different ways that people are coping with the various public health measures imposed upon them.