
I find that I will often need to add special characters such as “µ” in my figure labels. This is an example of one solution I found to add special characters into them. The solution? Unicode characters.
Unicode is a standardized coding scheme for characters of all languages. As of March 2020, there are close to 150,000 different characters with a corresponding unicode designation. To call a unicode symbol in R, you can simply type the corresponding sequence in a quoted string such as “\u03b1” which will print α.
I often need to label the axis of a plot with units such as “(µg/m³)”. The below example shows how you would do this.
library(ggplot2)
library(knitr)

x<-1:10
y<-1:10
data<-data.frame(x,y)

ggplot(data,aes(x, y)) +
  geom_point() +
  labs(title="Title",
       x= "concentration (\u00b5g/m\u00b3)",
       y= "y-axis title")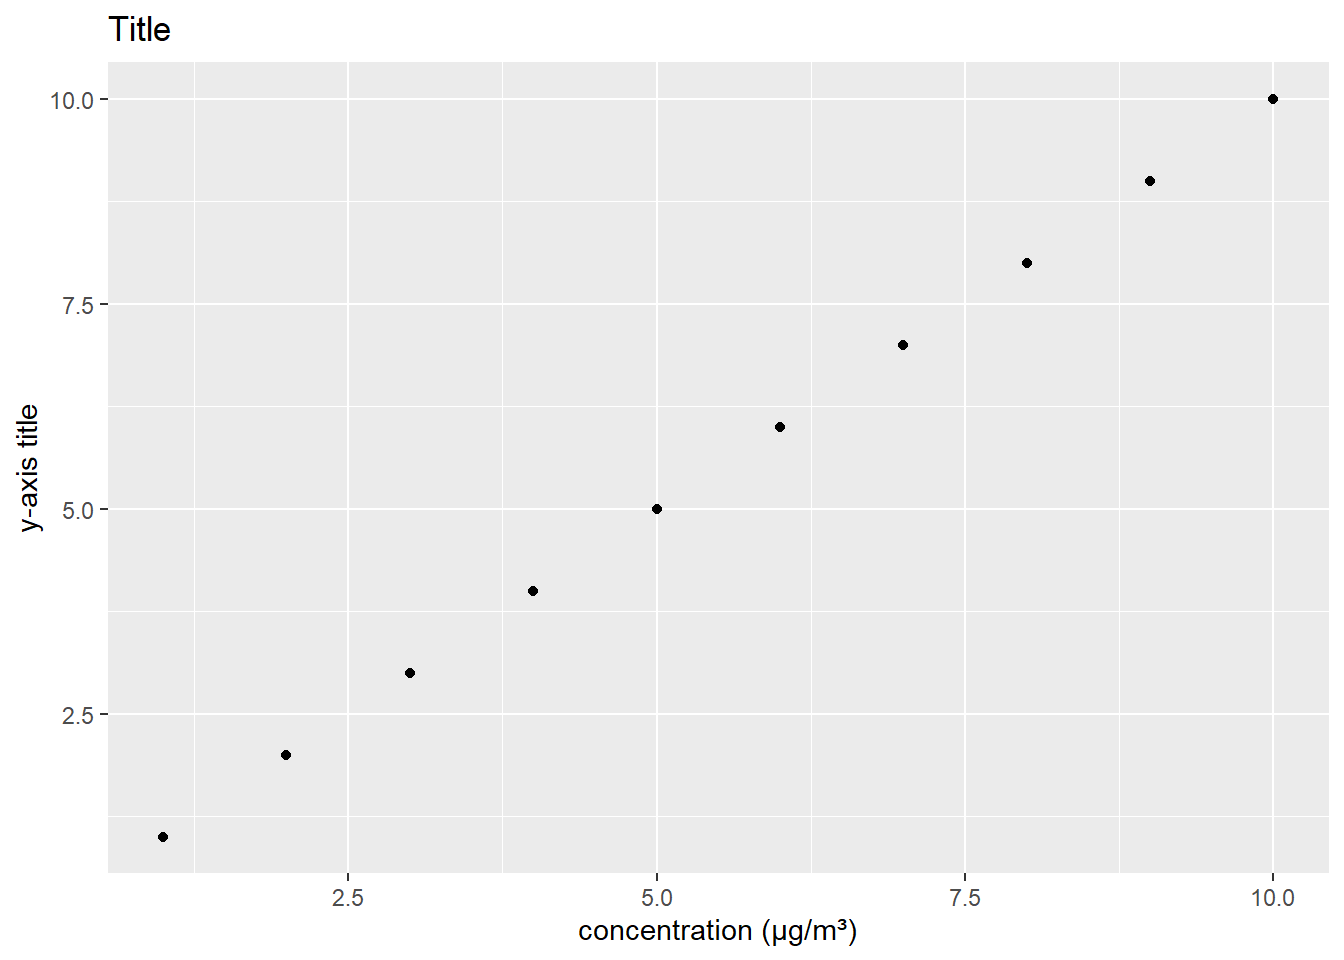
Pretty straightforward. I have heard of other ways, such as using bquote() function, or the latex2exp package but this method serves my usage well for now! See below for a table of characters that you may need to use, with their unicode (remember that you will need to insert the backslash “\” in order to correctly call the character). You can also just google the unicode value for a desired character.
Quick reference table
| character | output | unicode |
|---|---|---|
| degree | ° | u00b0 |
| alpha | α | u03b1 |
| beta | β | u03b2 |
| mu | µ | u00b2 |
| omega | Ω | u03a9 |
| squared | ² | u00b3 |
| cubed | ³ | u00b5 |
| subscript number | ₂ | u208_ (replace with desired number) |
| e accent aigu | é | u00e9 |
| e accent grave | è | u00e8 |